If you want to know how to monitor FPS and temperatures on a Windows PC, the short answer is this: run MSI Afterburner with RivaTuner Statistics Server for the on-screen display, and run HWiNFO64 in sensors-only mode so CPU package temperature shows up in that overlay too. Add your GPU vendor overlay if you want something cleaner. Set up takes about ten minutes and costs nothing.
That combination is the one that keeps coming up in gaming forum threads, and it is the reason I stopped guessing why a game stutters. Numbers on screen turn a vague feeling into something you can fix.
Updated for October 2026. Menu names shift between versions, so I have noted where things differ.
Table of Contents
- 1What You Need to Monitor FPS and Temperatures
- 2Step-by-Step
- 31. Choose a reliable monitoring method
- 42. Update drivers and enable the game overlay
- 53. Check FPS and frame-time stability
- 64. Monitor CPU and GPU temperatures
- 75. Compare results and take action
- 8Common Mistakes
- 9Frequently Asked Questions
- 10Is 60 FPS good enough for gaming?
- 11Why does my FPS average look fine but the game still stutters?
- 12Should I monitor CPU temperature or GPU temperature?
- 13Which tool can show FPS and temperatures on Windows?
- 14How long should I test a game while checking temperatures?
- 15Does a high temperature always mean my computer is overheating?
- 16Conclusion
What You Need to Monitor FPS and Temperatures
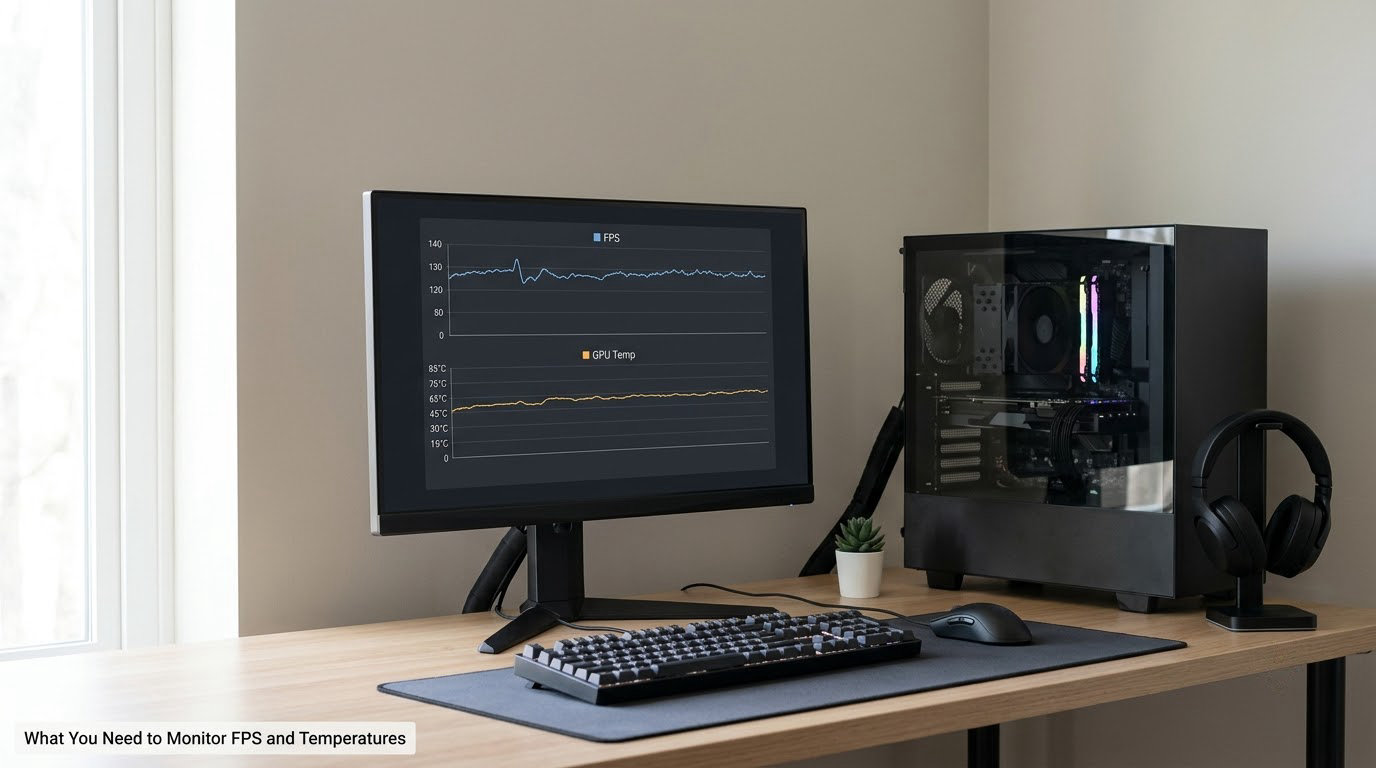
You need less than most people expect. A Windows desktop, current graphics drivers, and one monitoring application are the whole list. Everything else is optional.
- A Windows PC with a driver that matches your graphics card. Windows 10 and Windows 11 both work.
- Current graphics and chipset drivers. Old drivers produce overlay crashes and sensor failures that look like hardware problems.
- A monitoring application. MSI Afterburner with RivaTuner Statistics Server handles FPS, frametimes, GPU temperature and, once HWiNFO64 is sharing sensors, CPU temperature.
- A game with readable settings. Most PC games have a display or graphics menu with an FPS counter option already built in.
- Hardware sensor support. Temperature data comes from sensors on the CPU, the graphics card and the motherboard. If a reading is missing, the hardware may not expose it.
Desktops and laptops need different expectations, not different methods. The workflow is identical, but laptops run hotter and throttle sooner because the cooling is shared between CPU and GPU in a thin chassis. If you are on a laptop, read the temperature section twice before you panic at a number.
One optional addition: a second monitor. Running HWiNFO on a second screen instead of over the game keeps the overlay off your gameplay, and forum users report the resource cost is negligible.
Step-by-Step
1. Choose a reliable monitoring method
There are four families of monitoring method, and each answers a different question.
The in-game counter is built into almost every PC game. It gives you FPS, sometimes the resolution and renderer. It tells you nothing about temperature and usually nothing about frametime.
Windows built-in tools cover usage rather than heat. Xbox Game Bar opens with Win+G and its performance widget shows CPU, GPU, RAM and VRAM percentages. Task Manager’s Performance tab adds clock speeds and a rough temperature line on some hardware.
GPU control-panel overlays come with the card. NVIDIA users press Alt+Z to toggle the overlay, then open Settings and enable FPS, temperatures and utilization. AMD users open AMD Software: Adrenalin Edition, go to Performance, then Metrics to pin GPU temperature, usage and clocks. These look modern and cost almost nothing, but they report on the GPU and usually skip CPU temperature entirely.
Third-party hardware monitors read every sensor on the machine. MSI Afterburner works with any brand of graphics card, not just MSI ones, and its RivaTuner component draws the overlay. HWiNFO64 is the deepest sensor reader, with frametime graphs and logging to CSV. Open Hardware Monitor and HWMonitor cover the simpler cases. Whichever you pick, use the tools your hardware actually supports.
My default: Afterburner for the overlay, HWiNFO64 sharing sensors into it. That pairing gives you one screen with everything on it.
2. Update drivers and enable the game overlay
Start in Windows Settings, open Windows Update and check for optional driver updates. GPU drivers often arrive there rather than through Windows Update alone. If your card vendor has its own app, use that too.
Then enable the overlays:
- Afterburner: install, leave defaults alone, and RivaTuner Statistics Server starts with it. Open the RTSS user interface by right-clicking its tray icon and choose On-Screen Display to confirm it is enabled.
- HWiNFO64: run it, click the small gear icon, choose Sensors-only mode, and tick Shared memory support. Leave it running in the tray before you launch Afterburner. Without that, RTSS will not list CPU sensors.
- NVIDIA: press Alt+Z, open Settings, switch On-Screen Display on, then pick Performance and enable the items you want.
- AMD: open AMD Software, choose Performance, then Metrics, and enable the overlay there.
- Xbox Game Bar: press Win+G and confirm it is set to record the last 30 seconds. That recording is where the frametime graph lives.
If the overlay does not appear in-game, switch the game from fullscreen exclusive to borderless windowed. Overlays are injected into the window, and exclusive fullscreen does not give them one.
3. Check FPS and frame-time stability
Average FPS alone hides the problem. A game averaging 90 FPS can feel worse than one averaging 70 if its 1% lows sit at 40. What you feel is the bad part.
In RTSS, add these display elements:
- Framerate for the headline number.
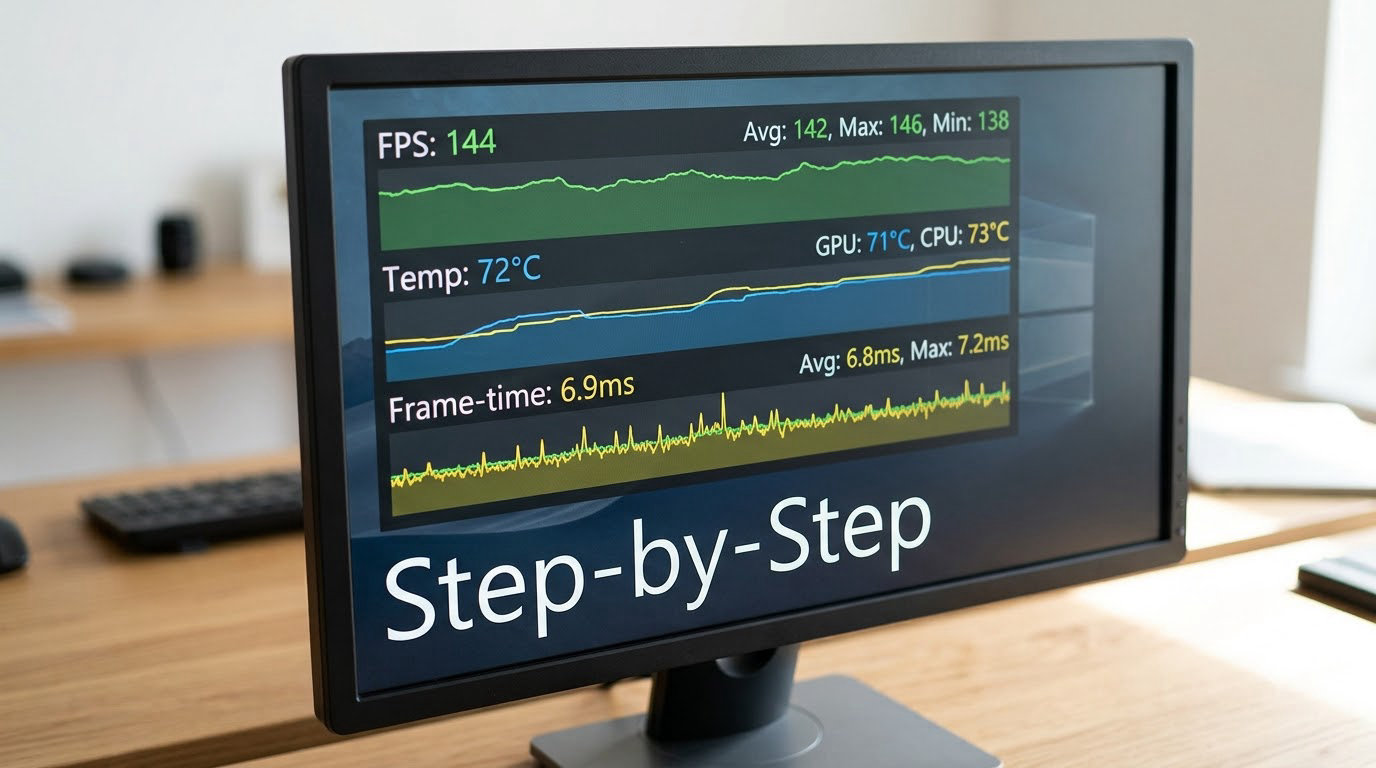
- Frametime for the real story. Steady around 11 ms is a locked 90 FPS; a line jumping between 7 ms and 40 ms is stutter.
- Framerate 1 percents for the 1% low, and add 0.1 percents if you want the mean frame.
- GPU temperature, CPU temperature and GPU usage alongside them.
To check the frametime graph, open Xbox Game Bar with Win+G during the run. It records the last 30 seconds, so trigger the stutter, hold Win+G, and read the graph. That sequence catches the hitch you were trying to reproduce.
Record a fixed test rather than a vibe check: one route, one difficulty, one weapon loadout, ten minutes. Anything less and you are comparing noise.
4. Monitor CPU and GPU temperatures
Open HWiNFO64 and widen the sensor list. Look for CPU Package (or Tctl/Tdie on some Ryzen chips) for the processor, and GPU Core plus GPU Hot Spot for the graphics card. Per-core readings show whether one core is running away from the rest.
Note current, minimum and maximum as the test runs. Hotspot matters more than core on modern cards: a GPU core at 70 C with a hotspot at 95 C is already losing performance to its own heat, even though the headline number looks fine.
Do not treat any single number as safe or dangerous. Limits come from your specific processor and card, and they differ across Intel, AMD and NVIDIA parts. Check the manufacturer’s specifications and the thermal design power for your chip, then compare against that. A desktop CPU running 85 C under load is not alarming if that chip is rated for it and the clock speeds are holding steady.
The useful signal is the pair: temperature plus clock speed. If clocks drop as temperature climbs, you are watching thermal throttling, and that is what causes the sudden dips in frametime.
5. Compare results and take action
Match symptoms to causes. Low FPS with cool temperatures usually means settings or a CPU limit. High temperatures with clocks that hold steady mean your cooling is working harder than it needs to. Unstable frametimes with normal temperatures point at background processes, storage hitching or a driver problem.
Here is the loop that works:
- Run the ten-minute test with your overlay recording.
- Write down settings, average FPS, 1% low, CPU package temperature, GPU core and GPU hotspot temperature.
- Change one setting, then repeat the identical test.
- Keep the change only if the numbers improved.
Change one thing at a time and you will learn which knob matters. Change five and you have no idea whether the game got faster or you just got lucky.
Common Mistakes
Reading only average FPS. Fix: add frametime and 1% low to the overlay before you judge anything.
Watching the wrong component. A 99% GPU reading means the graphics card is the limit and lowering CPU settings will not help. Fix: check both usage percentages first, then change the one that is pinned.
Testing for two minutes. Most thermal problems show up once the case fills with warm air and boost clocks settle. Fix: ten minutes minimum, ideally in the same room each time.
Comparing numbers from different hardware. Your 80 C is not your neighbour’s 80 C. Fix: check the rated limits for your exact chip before deciding anything.
Running an old overlay build. Outdated Afterburner and RivaTuner versions crash on newer games and titles. Fix: reinstall the current version before blaming your hardware.
Treating one hot sensor as proof of failure. A single spike during a load screen means nothing on its own. Fix: look at the ten-minute average and whether clocks dropped.
Changing several settings at once. You lose the cause. Fix: one change, one test, one note.
Ignoring frametime stutter. A steady FPS number with a jagged frametime graph still feels bad. Fix: read the graph, not just the counter.
Forgetting HWiNFO64 sensor sharing. Afterburner shows GPU temperature by default and no CPU temperature at all. This is the most common confusion on the forums, and the fix is exactly what step 2 covers: run HWiNFO64 in sensors-only mode with shared memory enabled before Afterburner.
Two more that come up constantly. Anti-cheat in some multiplayer titles can block or crash overlays, so test in single player first to confirm your setup is fine. And if you dislike the overlay look entirely, FanControl puts temperatures in the Windows tray instead.
On hardware care, keep the intake filters clear and leave a few centimetres behind the case for airflow. If you make any change to cooling, thermal paste or fan curves, re-run the same ten-minute test and compare. That record is what tells you whether the change helped.
Frequently Asked Questions
Is 60 FPS good enough for gaming?
For most players, yes, as long as the frame rate holds steady. What matters more than the number is how stable it is: a locked 60 FPS with frametime under about 16.7 ms feels better than an average of 75 that keeps dipping into the 40s. Competitive shooters and fast action games benefit from anything above 100, where your monitor can show it. Check your monitor’s refresh rate too, since a 144 Hz panel at a locked 60 looks worse than a 60 Hz panel doing the same.
Why does my FPS average look fine but the game still stutters?
Because averages hide the bad frames. A few slow frames every second drag the average up while hurting how the game feels. Turn on frametime and 1% low readings in RivaTuner Statistics Server and watch the graph during the hitch. Common causes are shader compilation, storage stalls, background processes and CPU-limited scenes where the GPU sits under 90%. Open Xbox Game Bar with Win+G after the hitch to see the last 30 seconds.
Should I monitor CPU temperature or GPU temperature?
Monitor both, and look at them together with clock speeds. The GPU is usually the priority because it drives frame rate in most games, and the GPU hotspot reading matters more than core temperature on modern cards. The CPU reading tells you whether the processor is throttling or whether a game is CPU-limited. Hot temperatures with steady clocks are fine; climbing temperature with falling clocks is the combination that costs you frames.
Which tool can show FPS and temperatures on Windows?
MSI Afterburner with RivaTuner Statistics Server is the most complete free option, showing FPS, frametime, 1% lows, GPU temperature and CPU temperature once HWiNFO64 shares its sensors. HWiNFO64 alone is best for sensor detail and logging. NVIDIA users can press Alt+Z for a cleaner overlay, and AMD users can enable Metrics in AMD Software. Xbox Game Bar, opened with Win+G, needs no install but reports usage percentages rather than temperatures.
How long should I test a game while checking temperatures?
Ten minutes of real gameplay in a repeatable scenario is a good minimum. Short tests catch nothing because boost clocks and fans behave differently in the first minute. Use the same route, difficulty and loadout each time, and keep room temperature steady if you can. For a laptop, test longer since the chassis needs time to heat up before throttling kicks in.
Does a high temperature always mean my computer is overheating?
No. Temperature limits differ per chip, so a reading only means something against the manufacturer rating for your hardware. Desktop CPUs commonly sit between 65 and 90 C under gaming load, and laptop CPUs between 85 and 95 C, with forum users confirming the higher laptop figures are normal for thin-and-light machines. What matters is whether clock speeds hold steady. Sustained drops in clock speed with rising temperature mean real thermal throttling.
Conclusion
Start tonight: install MSI Afterburner and HWiNFO64, turn on sensors-only mode with shared memory enabled, then add FPS, frametime, 1% low and both temperatures to the overlay. Run one ten-minute test and write the numbers down. Once you have a baseline, every later change becomes something you can actually measure.